



Geotechnical Engineering Modelling Software ai
Verification & Validation
This page brings together worked examples in which GEMSai results are checked against independent references — physical model tests and established closed-form and chart-based solutions — so that you can see for yourself how the software performs. Each example sets out the full input data, the reference it is compared against, and the results side by side, including the places where the two differ and why.
We will keep adding examples across the GEMSai foundation analysis suite.
Laterally Loaded Pile in Sand — GEMSai vs Centrifuge Model Test
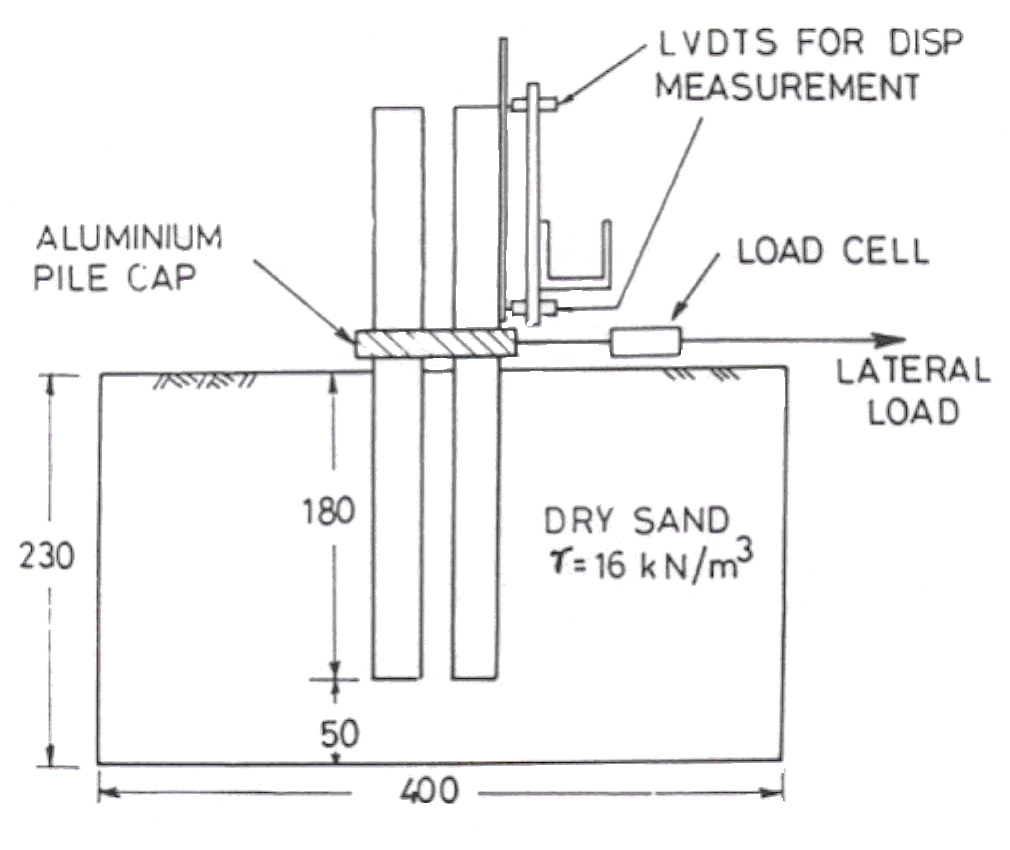
This example compares the response of a single pile in dry sand, measured in a geotechnical centrifuge, with the response computed by the GEMSai Offshore Pile Foundation software using the API p-y method. Centrifuge testing reproduces full-scale stress levels in a small model, so a 25 mm model pile spun at 50 g behaves like a 1.25 m diameter prototype pile. That makes it one of the most demanding checks available for a lateral pile analysis: the comparison is against measured physical behaviour, not against another calculation.
The results of this comparison were presented by Prof. V.S. Chandrasekaran in the T.S. Nagaraj Memorial Lecture, organised by the Indian Geotechnical Society Bengaluru chapter in November 2020.
Test set-up
Input data
| Centrifuge model | Equivalent real life pile dimensions | |
|---|---|---|
| Acceleration level | 50 g | – |
| Pile diameter | 25 mm | 1.25 m |
| Embedded length | 180 mm | 9.0 m |
| Property | Value |
|---|---|
| Soil type | Dry sand |
| Effective size | 150 µm |
| Uniformity coefficient | 1.5 |
| Grading | 80% between 150–250 µm |
| Angle of internal friction, φ | 32° |
| Dry unit weight | 16 kN/m³ |
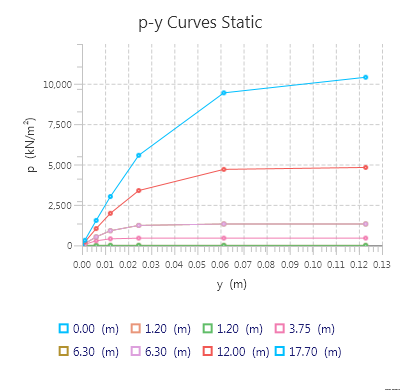
The prototype pile and soil were modelled in GEMSai, and the generated static API p-y curves are shown below.
Results
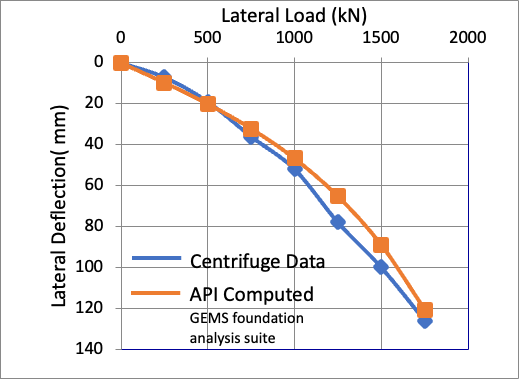
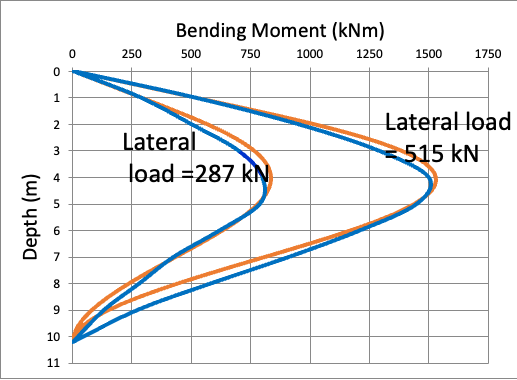
Note: Based on the two graphs above, the GEMSai pile foundation software results are in line with the experimental centrifuge test results.
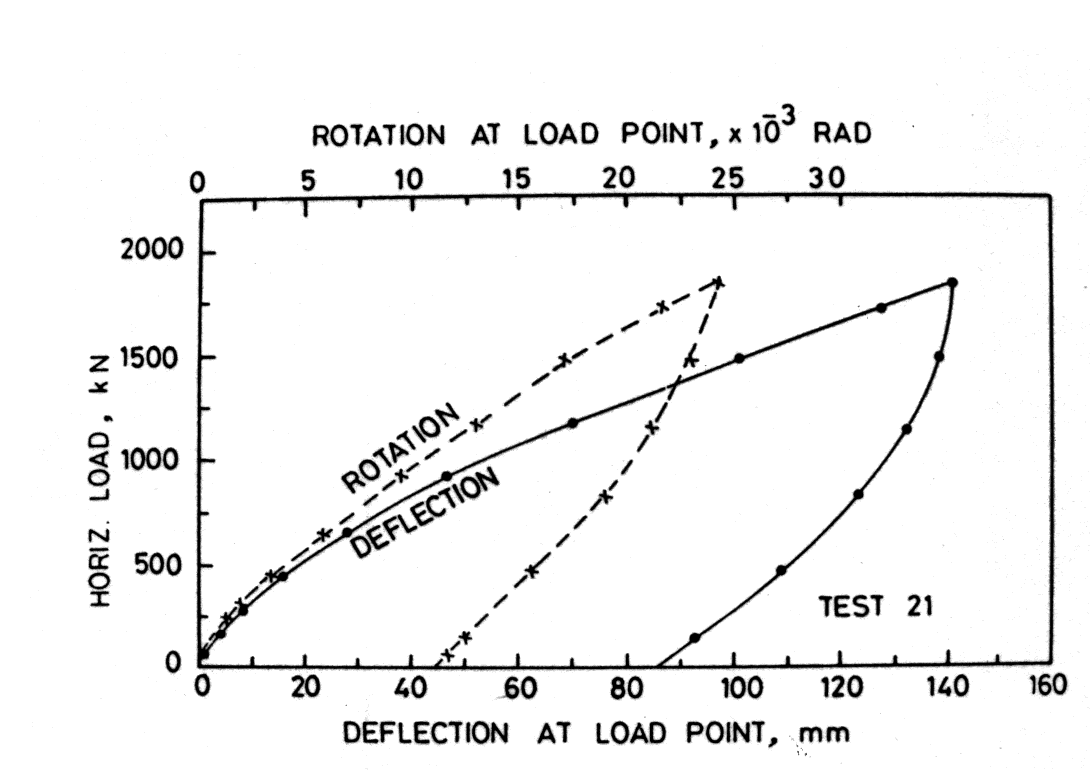
References
- Kulkarni, K.R., Chandrasekaran, V.S. and King, G.J.W. (1985). “Centrifugal model studies on laterally loaded pile groups in sand.” 11th International Conference on Soil Mechanics and Foundation Engineering, San Francisco (1985).
- American Petroleum Institute. ANSI/API RP 2GEO, Geotechnical and Foundation Design Considerations, 2011.
Laterally Loaded Long Pile — GEMSai vs Reese Charts
This example checks the GEMSai laterally loaded pile analysis against calculations based on the Reese charts for a pile in soil whose modulus of subgrade reaction increases linearly with depth (the nh model). The Reese charts and tables are based on the finite difference method, whereas GEMSai uses the finite element method. Both are highly accurate numerical methods, so for the same idealised soil the two should agree closely — and they do.
Input data
| Parameter | Value |
|---|---|
| Pile diameter, D | 0.4 m |
| Pile length, L | 24.19 m |
| Elastic modulus, E | 3.3 × 10⁷ kN/m² |
| Linear variable subgrade modulus, nh | 500 kN/m³ |
| Lateral load at pile head, Pt | 25.0 kN |
| Head condition | Free head |
Hand calculation using the Reese chart coefficients
Results
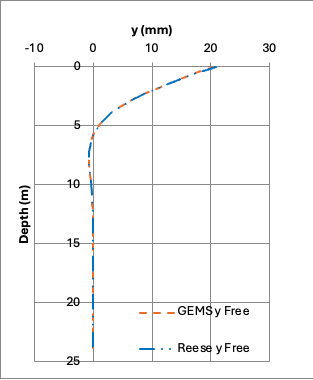
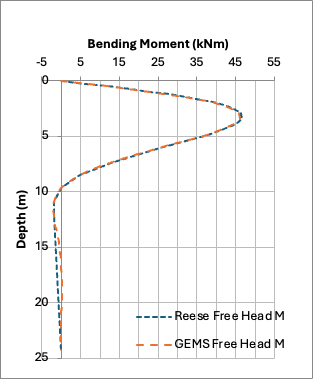
| Depth (m) | Lateral deflection | Bending moment | ||
|---|---|---|---|---|
| y Reese (mm) | y GEMSai (mm) | BM Reese (kNm) | BM GEMSai (kNm) | |
| 0.00 | 20.80 | 20.58 | 0.00 | 0.00 |
| 0.48 | 18.04 | 17.85 | 11.98 | 11.82 |
| 0.97 | 15.34 | 15.18 | 22.93 | 22.65 |
| 1.45 | 12.78 | 12.64 | 32.18 | 31.79 |
| 1.94 | 10.38 | 10.28 | 39.26 | 38.80 |
| 2.42 | 8.22 | 8.14 | 43.98 | 43.49 |
| 2.90 | 6.30 | 6.24 | 46.40 | 45.90 |
| 3.39 | 4.65 | 4.60 | 46.70 | 46.19 |
| 3.87 | 3.25 | 3.22 | 45.13 | 44.66 |
| 4.36 | 2.11 | 2.09 | 42.10 | 41.67 |
| 4.84 | 1.21 | 1.20 | 37.99 | 37.62 |
| 7.26 | −0.64 | −0.64 | 13.61 | 13.46 |
| 9.68 | −0.43 | −0.43 | 0.00 | −0.02 |
| 12.10 | −0.08 | −0.08 | −2.00 | −2.01 |
| 24.20 | 0.00 | 0.00 | 0.00 | 0.00 |
Full Reese chart calculation table
| Depth z (m) | Lateral deflection | Bending moment | ||
|---|---|---|---|---|
| Ay | y (mm) | Am | BM (kNm) | |
| 0.00 | 2.435 | 20.80 | 0 | 0.00 |
| 0.24 | 2.273 | 19.41 | 0.100 | 6.05 |
| 0.48 | 2.112 | 18.04 | 0.198 | 11.98 |
| 0.73 | 1.952 | 16.67 | 0.291 | 17.60 |
| 0.97 | 1.796 | 15.34 | 0.379 | 22.93 |
| 1.21 | 1.644 | 14.04 | 0.459 | 27.77 |
| 1.45 | 1.496 | 12.78 | 0.532 | 32.18 |
| 1.69 | 1.353 | 11.55 | 0.595 | 35.99 |
| 1.94 | 1.216 | 10.38 | 0.649 | 39.26 |
| 2.18 | 1.086 | 9.27 | 0.693 | 41.92 |
| 2.42 | 0.962 | 8.22 | 0.727 | 43.98 |
| 2.90 | 0.738 | 6.30 | 0.767 | 46.40 |
| 3.39 | 0.544 | 4.65 | 0.772 | 46.70 |
| 3.87 | 0.381 | 3.25 | 0.746 | 45.13 |
| 4.36 | 0.247 | 2.11 | 0.696 | 42.10 |
| 4.84 | 0.142 | 1.21 | 0.628 | 37.99 |
| 6.05 | −0.020 | −0.17 | 0.422 | 25.53 |
| 7.26 | −0.075 | −0.64 | 0.225 | 13.61 |
| 8.47 | −0.074 | −0.63 | 0.081 | 4.90 |
| 9.68 | −0.050 | −0.43 | 0 | 0.00 |
| 10.89 | −0.026 | −0.22 | −0.032 | −1.94 |
| 12.10 | −0.009 | −0.08 | −0.033 | −2.00 |
| 24.20 | 0 | 0.00 | 0 | 0.00 |
Full GEMSai output table
| Depth (m) | Deflection (mm) | Bending moment (kNm) |
|---|---|---|
| 0 | 20.579 | 0 |
| 0.484 | 17.847 | 11.82 |
| 0.968 | 15.18 | 22.653 |
| 1.452 | 12.641 | 31.79 |
| 1.936 | 10.281 | 38.798 |
| 2.42 | 8.138 | 43.494 |
| 2.904 | 6.24 | 45.897 |
| 3.387 | 4.6 | 46.188 |
| 3.87 | 3.22 | 44.66 |
| 4.36 | 2.092 | 41.674 |
| 4.84 | 1.198 | 37.622 |
| 5.32 | 0.517 | 32.888 |
| 5.81 | 0.021 | 27.828 |
| 6.29 | −0.318 | 22.748 |
| 6.78 | −0.528 | 17.898 |
| 7.26 | −0.637 | 13.461 |
| 7.74 | −0.669 | 9.56 |
| 8.23 | −0.648 | 6.263 |
| 8.71 | −0.59 | 3.586 |
| 9.20 | −0.512 | 1.509 |
| 9.68 | −0.426 | −0.018 |
| 10.16 | −0.339 | −1.064 |
| 10.65 | −0.258 | −1.706 |
| 11.13 | −0.187 | −2.026 |
| 11.61 | −0.126 | −2.103 |
| 12.10 | −0.078 | −2.007 |
| 12.58 | −0.041 | −1.799 |
| 13.07 | −0.014 | −1.531 |
| 13.55 | 0.004 | −1.24 |
| 14.03 | 0.016 | −0.955 |
| 14.52 | 0.022 | −0.696 |
| 15.002 | 0.024 | −0.472 |
| 15.486 | 0.023 | −0.29 |
| 15.97 | 0.02 | −0.149 |
| 16.454 | 0.017 | −0.046 |
| 16.937 | 0.014 | 0.024 |
| 17.421 | 0.01 | 0.067 |
| 17.905 | 0.007 | 0.088 |
| 18.389 | 0.005 | 0.095 |
| 18.873 | 0.003 | 0.09 |
| 19.357 | 0.001 | 0.08 |
| 19.841 | 0 | 0.066 |
| 20.325 | 0 | 0.051 |
| 20.809 | −0.001 | 0.038 |
| 21.293 | −0.001 | 0.026 |
| 21.777 | −0.001 | 0.017 |
| 22.261 | −0.001 | 0.01 |
| 22.745 | −0.001 | 0.005 |
| 23.229 | −0.001 | 0.002 |
| 23.712 | 0 | 0 |
| 24.196 | 0 | 0 |
Discussion
The results from GEMSai compare extremely well with the calculations based on the Reese charts. Pile head deflection and maximum bending moment agree to within about 1%, and the deflection and bending moment curves down the pile are practically indistinguishable from one another. The maximum moment occurs at the same depth, 1.4T = 3.387 m, in both. This confirms the reliability of the GEMSai lateral pile analysis — and unlike a chart solution, GEMSai is not limited to an idealised linearly increasing soil modulus, so the same analysis extends directly to real, layered soil profiles.
Try It on Your Own Project
Run these examples yourself, or your own pile designs, with a free GEMSai trial.
Request a Free TrialCopyright © All Rights Reserved